ErrorStack – Graphite – StatsD – NodeJS – Cron Success Story
At work I am implementing ErrorStack, Graphite, and StatsD into our projects and tools. We are doing this so we can better understand how our users interact with our products and so we can respond faster and more efficiently to errors.
- ErrorStack helps us collect, report, and notify us of errors across all of our applications no matter where they are.
- Graphite stores and graphes analytical data provided by our products.
- StatsD run by NodeJS collects our analytical data via UDP so there is minimal impact on the performance of our applications as we collect the data.
- Cron helps us run various tasks on our servers and helps us ensure that things are running smoothly
I recently setup a Cron script to ensure that Node is running. If the script finds that Node is no longer running, it reports the issue to ErrorStack and then kicks off the process again. This ensures that we will be able to collect data via StatsD with minimal interruptions. Because I keep a browser window open to keep an eye on some key stats in graphite, I noticed a sudden drop in total metrics received and written to disk.
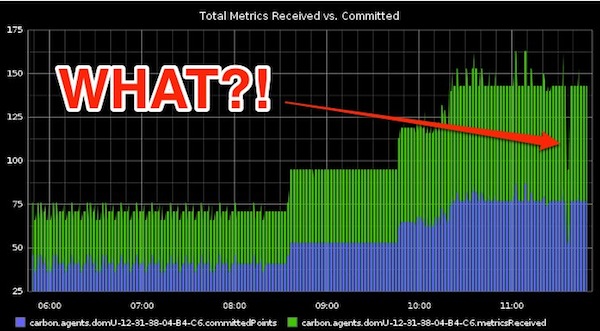
Just a minute or two later I got an email alert from ErrorStack notifying me that Node had died. After checking the graphite graph again I saw that the total metrics received had gone back up because the Cron script was able to restart the process. I love it when a plan comes together like that.
#!/bin/bash
PID=`pidof node`
if [ $PID > 0 ]; then
  echo "node still running"
else
  echo "node died"
  curl -d "Msg=node died&_s=yourErrorStackKeyGoesHere&_r=json" http://www.errorstack.com/submit
  # command to start node server again goes here
fi
Here is some of the code that I use to report errors to ErrorStack https://github.com/MikeGrace/ErrorStack-Reporting-Tools